Housing market data for every U.S. market
Housing market data, forecasts, and risk for every U.S. county and ZIP. Every county.
Every metric.
One map.
Curb Report is housing market data for every U.S. county and ZIP: home price forecasts, crash risk, cap rate, and the true-cost math in one place, so you can act with conviction instead of guessing.
Free to start. No credit card. 3,142 counties and 31,000+ ZIP codes.
Switch the lens
Same map. Any question.
Recolor the country by the metric that matters to your decision. Forecast today, crash risk next, true after-tax cost after that.
Plus 8 proprietary Insight Scores spanning forecast, investment, crash risk, tax burden, and livability.
The unsexy lines that decide deals
The math Zillow never shows you.
Listing sites stop at price and a payment estimate. The numbers that actually decide a deal live in a dozen other tabs. We do that math for you, per market.
- After-tax investor mathYour real after-tax rental return after property tax and your bracket, not a gross headline yield.
- Insurance-adjusted cap ratesYields that subtract real insurance cost, the line that sinks Gulf and wildfire deals.
- Supply pipeline trackerPermits and new supply that signal where prices soften next.
- Tax burden scoreProperty tax by county distilled into one number for the true cost of owning here versus the market next door.
Everything inside Curb Report
From a national housing map down to a single offer.
Start on the map, zoom into any market, then use the same data to screen, compare, and decide. Here is the whole toolkit, with real screenshots.
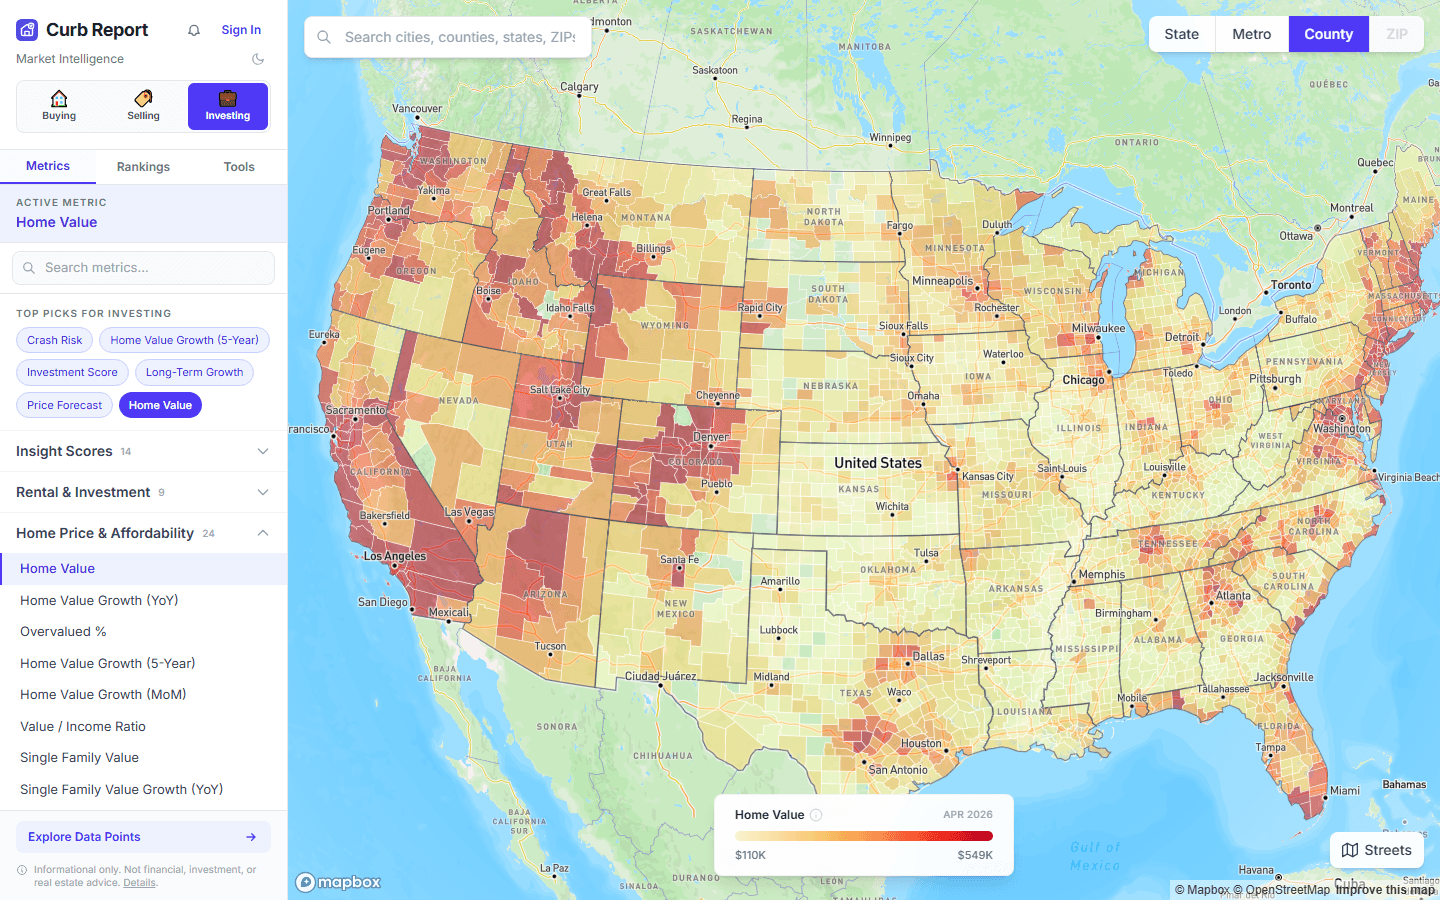
Interactive heat maps
Color the entire country by any of 100+ metrics. Home values, 12-month forecasts, crash risk, cap rate, climate risk, property tax. Zoom from the nation down to a single ZIP and the map recolors instantly.
- Every county and 31,000+ ZIPs
- One click to switch the metric
- State, metro, county, and ZIP levels
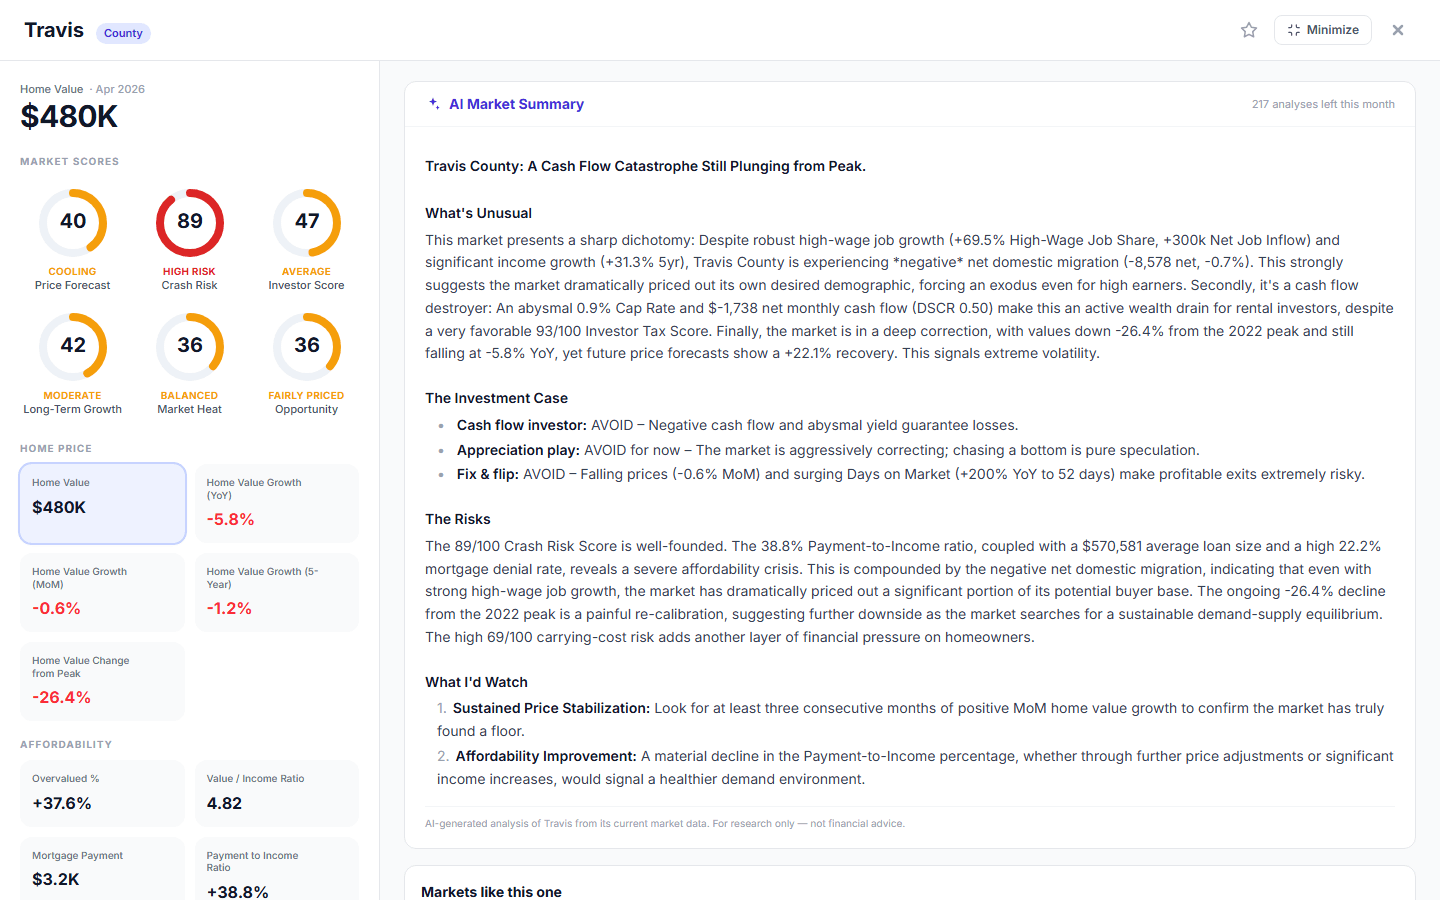
The full market dashboard
Open any market into one full dashboard: Insight Score rings for forecast, crash risk, and investment, a 12-month price outlook, an AI market summary, and a deep breakdown of price, risk, yield, and demographics. The whole picture on one screen, no tab juggling.
- 8 proprietary Insight Scores at a glance
- AI market summary in plain English
- 100+ metrics across price, risk, and yield
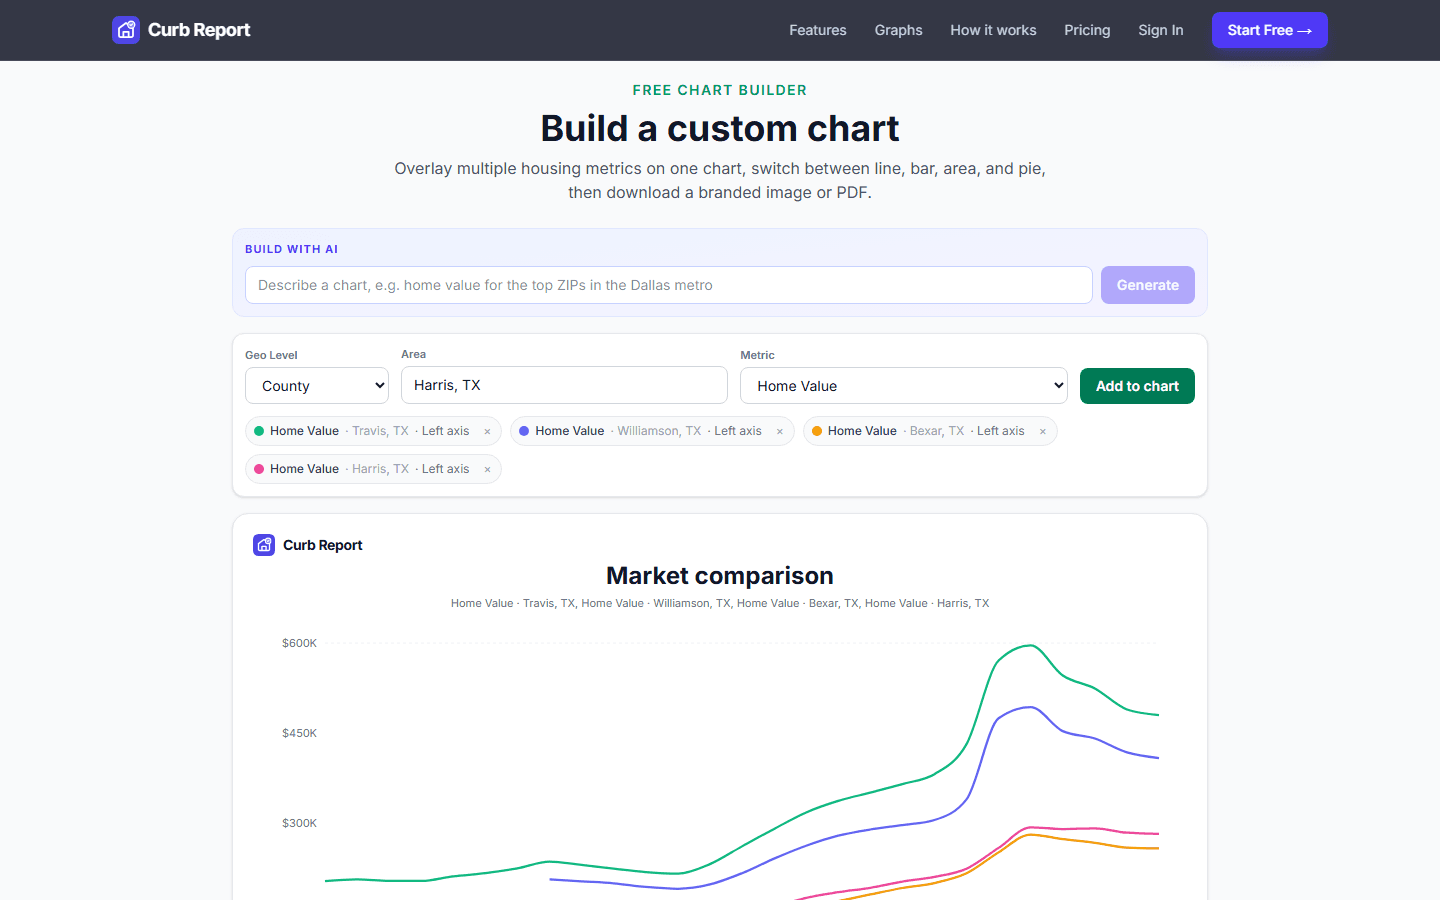
Custom chart builder
Compare several markets on one chart, or overlay multiple metrics, then switch between line, bar, area, and pie and download a branded image or PDF. Build it by hand, or just describe the chart you want and let the AI build it for you.
- Compare up to 6 markets or metrics
- Branded image and PDF export
- Build it yourself or with AI
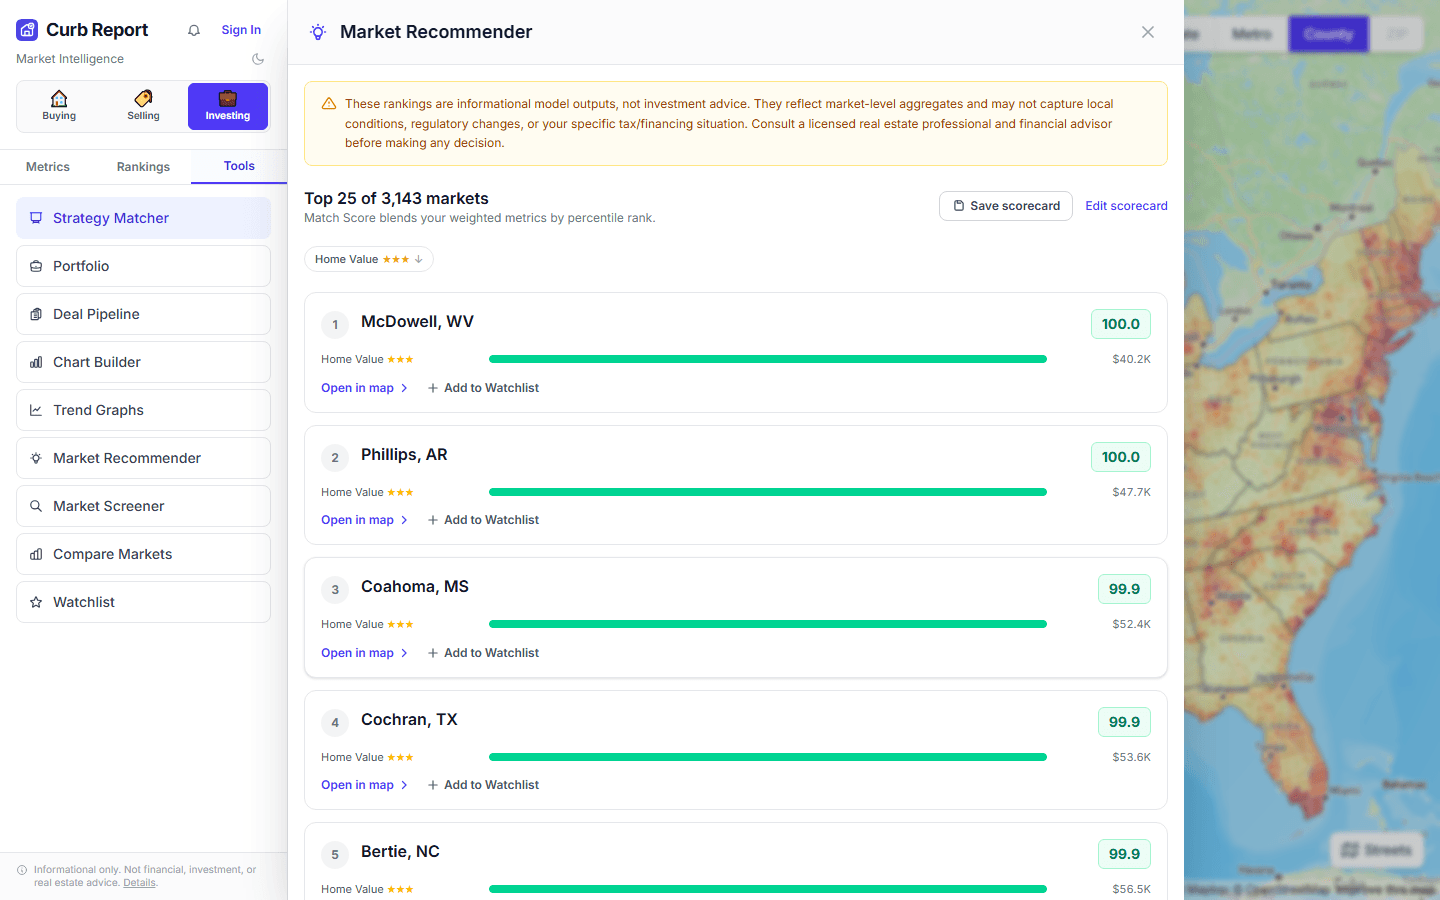
Market Recommender
Tell us which metrics matter and how much, then rank all 3,143 markets by a single Match Score built from your weighted priorities. Save the scorecard and rerun it any time the data refreshes.
- Weight any metrics into one Match Score
- Ranks all 3,143 counties or metros
- Save and reuse your scorecard
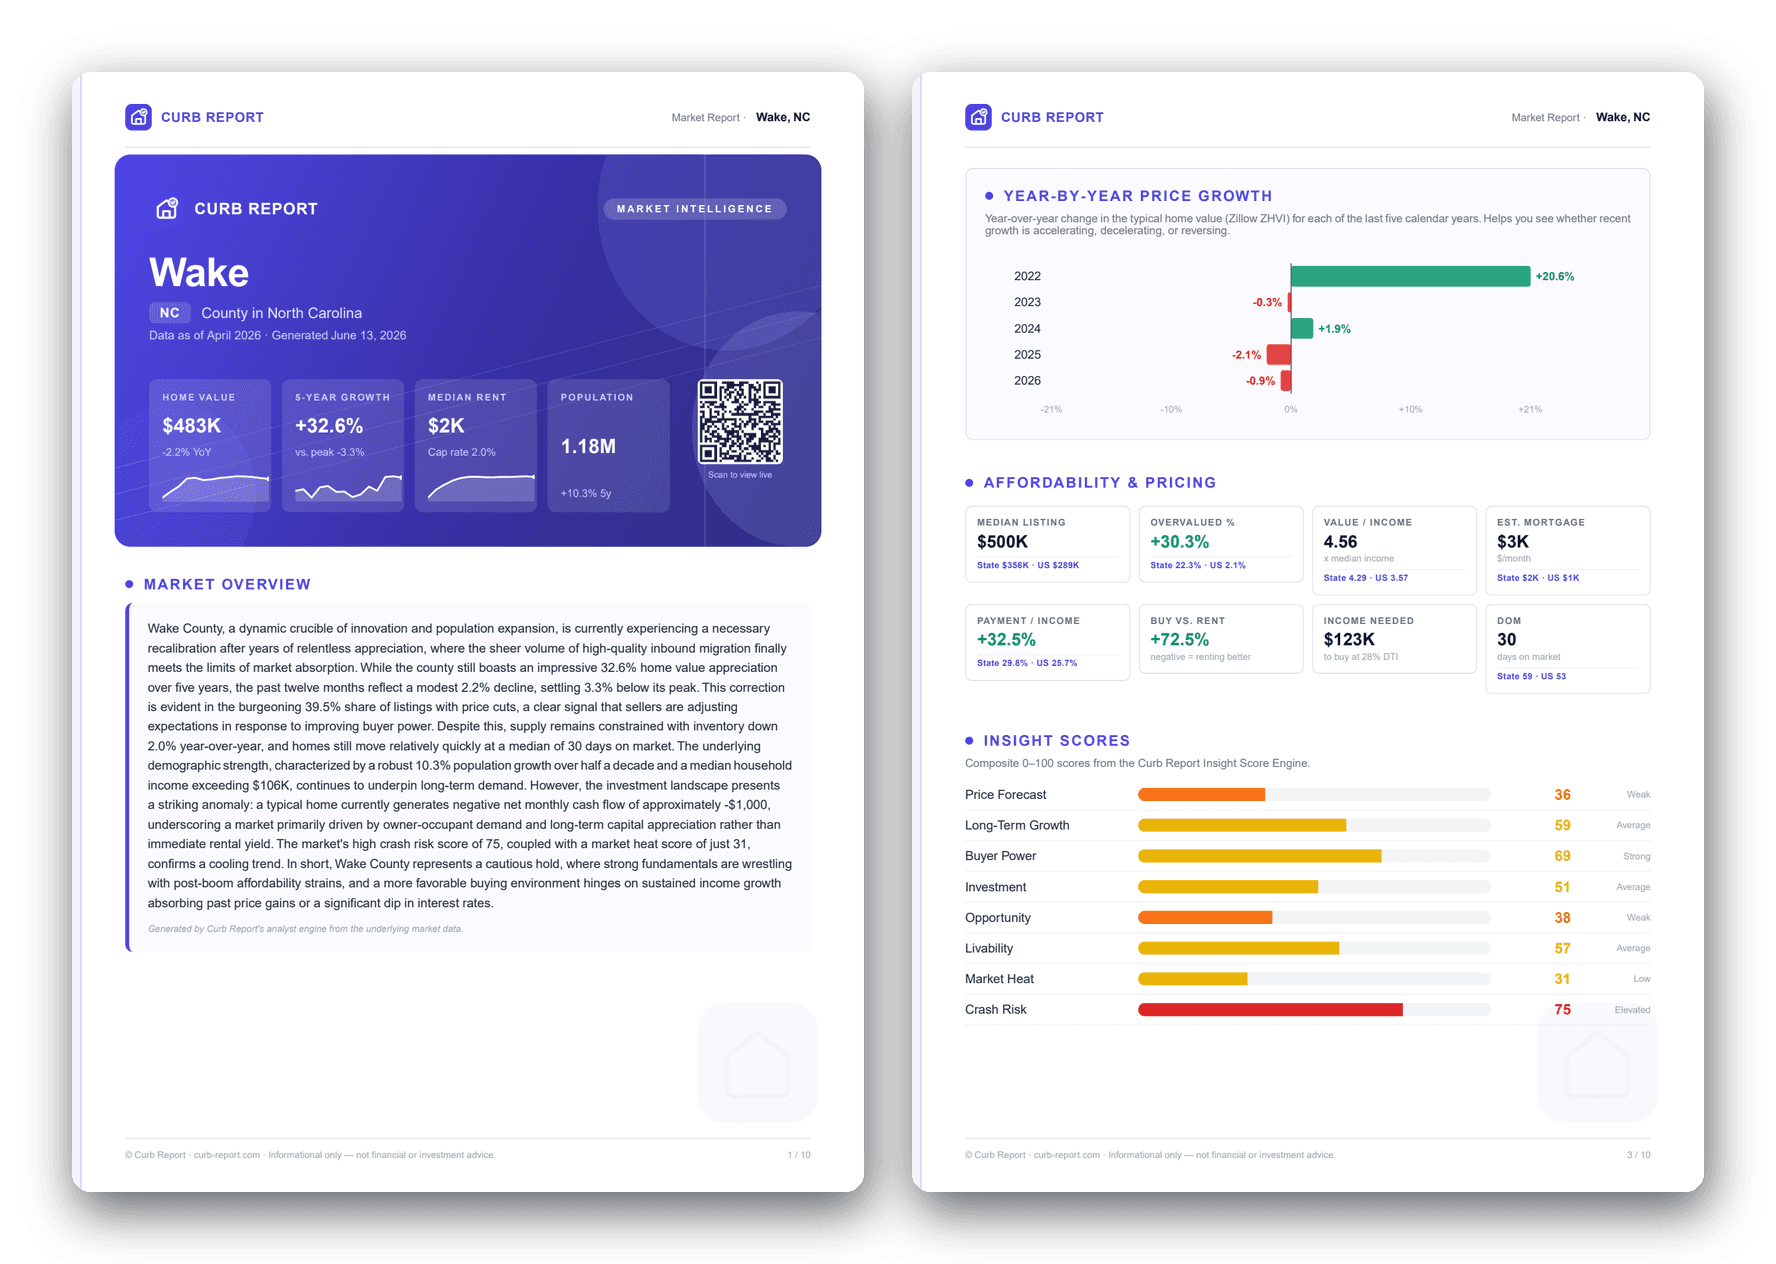
Comprehensive market reports
Generate a deep, data-rich PDF for any state, county, ZIP, or metro: a branded cover, home values and forecasts, an investment verdict, a crash-risk gauge, Insight Scores, affordability, demographics, taxes, and an AI market summary. Ten pages, ready to share.
- States, counties, ZIPs, and metros
- 100+ metrics with charts and gauges
- Branded, shareable PDF download
The Pro toolkit
Turn the data into a decision.
The tools that take you from an interesting market to a confident offer.
AI Market Advisor
Ask any market question in plain English and get a sourced, data-backed answer in seconds. No spreadsheets, no guessing.
Market Screener
Filter all 3,000+ counties by any combination of 100+ metrics to surface the markets that fit your exact criteria.
Curb Check
Paste any listing link and get a suggested offer range plus a seller-leverage read before you write the offer.
Compare markets
Put your finalist markets side by side across every metric and make the call with confidence.
Watchlist and alerts
Track the markets you care about and get notified when price, forecast, or risk shifts in any of them.
Strategy Matcher
Tell us your goal, cash flow, appreciation, or flips, and get a ranked shortlist of markets that match it.
Agent reports
Generate a branded, client-ready market report under your own name and logo, with a shareable link that captures leads for you.
Start free. Upgrade when it pays for itself.
One bad assumption costs more than a year of Pro.
Core metrics, state and county maps, price forecast, crash risk, and the investment calculator. No credit card.
Start freeAll 100+ metrics, ZIP-level data, PDF reports, historical time-series, and the browser extension.
Choose StarterEverything in Starter plus Screener, Watchlist, Compare, Curb Check, Strategy Matcher, and the AI tools.
Go ProStop guessing. Open the map.
Every county, every metric, and the true-cost math in one view. Pick a market and see it in seconds.
Free to start. No credit card. Refreshed monthly from 12+ official sources.
Questions
Frequently asked questions
- What is Curb Report?
- Curb Report is a real estate market intelligence platform that puts 100+ housing metrics for every U.S. county and ZIP code on one interactive map, including home price forecasts, crash risk, cap rate, property taxes, climate risk, and AI analysis.
- What housing data does Curb Report cover?
- We track 100+ metrics across 3,142 counties and 31,000+ ZIP codes, refreshed monthly from 12+ official sources including Zillow, Redfin, the U.S. Census Bureau, FRED, HUD, BLS, NOAA, EPA, and FEMA.
- Is Curb Report free?
- Yes. The free plan covers core metrics, state and county maps, price forecasts, crash risk, and the investment calculator with no credit card. Starter is $19.99 per month and Pro is $39.99 per month.
- How accurate are the home price forecasts?
- Forecasts are model-based 12-month outlooks built from historical price trends, supply, and local fundamentals. They are estimates to inform a decision, not guarantees, and they refresh every month as new data lands.
- Who is Curb Report for?
- Home buyers, sellers, real estate investors, and agents who want every metric for a market in one place instead of juggling a dozen browser tabs.
- What makes Curb Report different from Zillow?
- Zillow shows you listings. Curb Report shows you the decision. We do the math listing sites skip: after-tax investor returns, insurance-adjusted cap rates, the supply pipeline, and a tax-burden score for every market.
- What is a good cap rate?
- A good cap rate depends on the market and your strategy, but many rental investors look for 5 to 8 percent. Curb Report shows the cap rate for every county and ZIP, plus an insurance-adjusted version so you compare real yields, not headline ones.
- Is now a good time to buy a house?
- It depends on the local market, not the national headline. Curb Report gives each market a 12-month home price forecast, a crash-risk score, and an affordability read so you can judge the timing market by market.
- How do you forecast home prices?
- Our home price forecasts are model-based 12-month outlooks built from historical price trends, supply and new construction, incomes, and local fundamentals. They are estimates to inform a decision, not guarantees, and they refresh every month.